Veltrix AI
Product
How it Works?
See how to use Veltrix to turn raw data into real growth.
Knowledge Base
Fresh insights and smart guides to master your data game
Solutions
Finance Teams
Automate reporting and analysis.
FP&A
Strategic forecasting and variance.
Accounting
Close the books in hours.
Founders & CEOs
Track burn, runway, and growth.
Sales & Marketing
Maximize ROI and pipeline health.
Pricing
About us
Careers
Contact Us
Log in
Try it Free
See how it works
Book a Demo
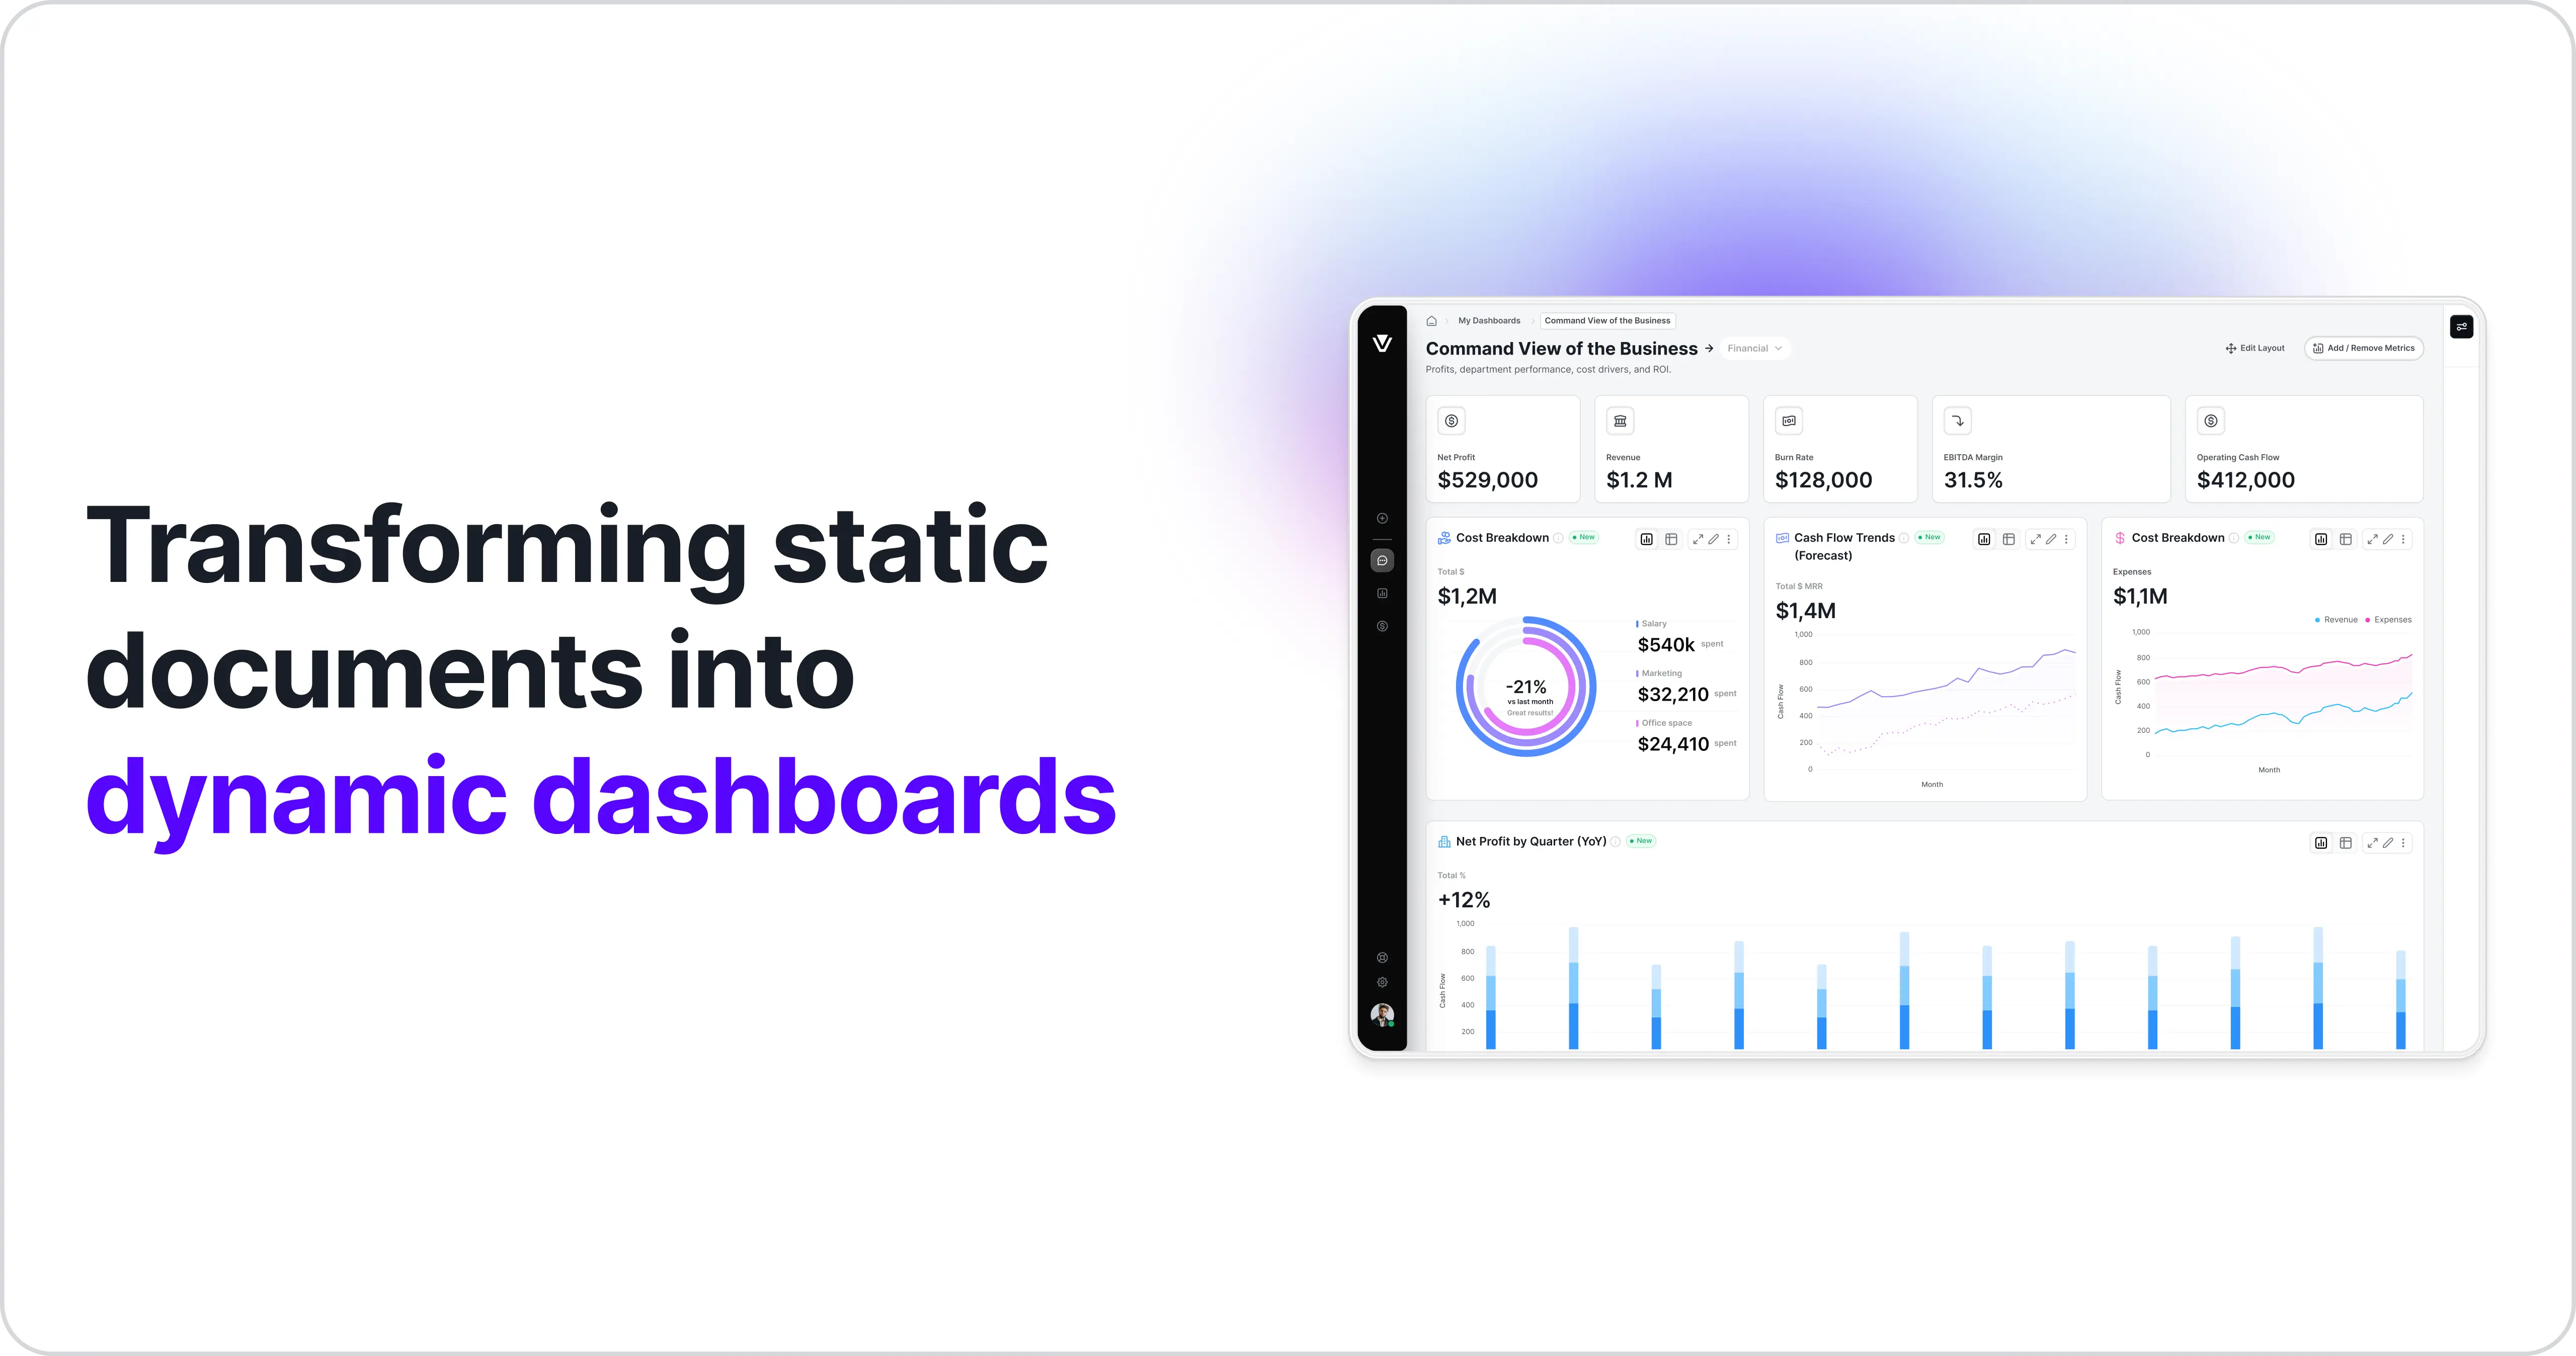
Turn Your Data into Smart Dashboards
Instant AI analytics for your financial statements and spreadsheets.
Launch Interactive Demo
Sign Up for Free
Your browser does not support the video tag.
Unmute
Veltrix AI turns static financial data into smart dashboards. Uncover insights and decide faster.
Turn any financial data into actionable insights
— Veltrix pulls the key metrics from your statements and builds interactive charts you can actually use.
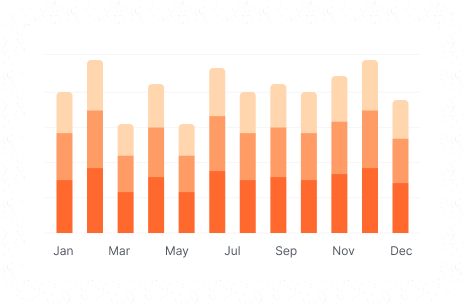
Static • Non-interactive • Hard to analyze
Before
The transformation is clear
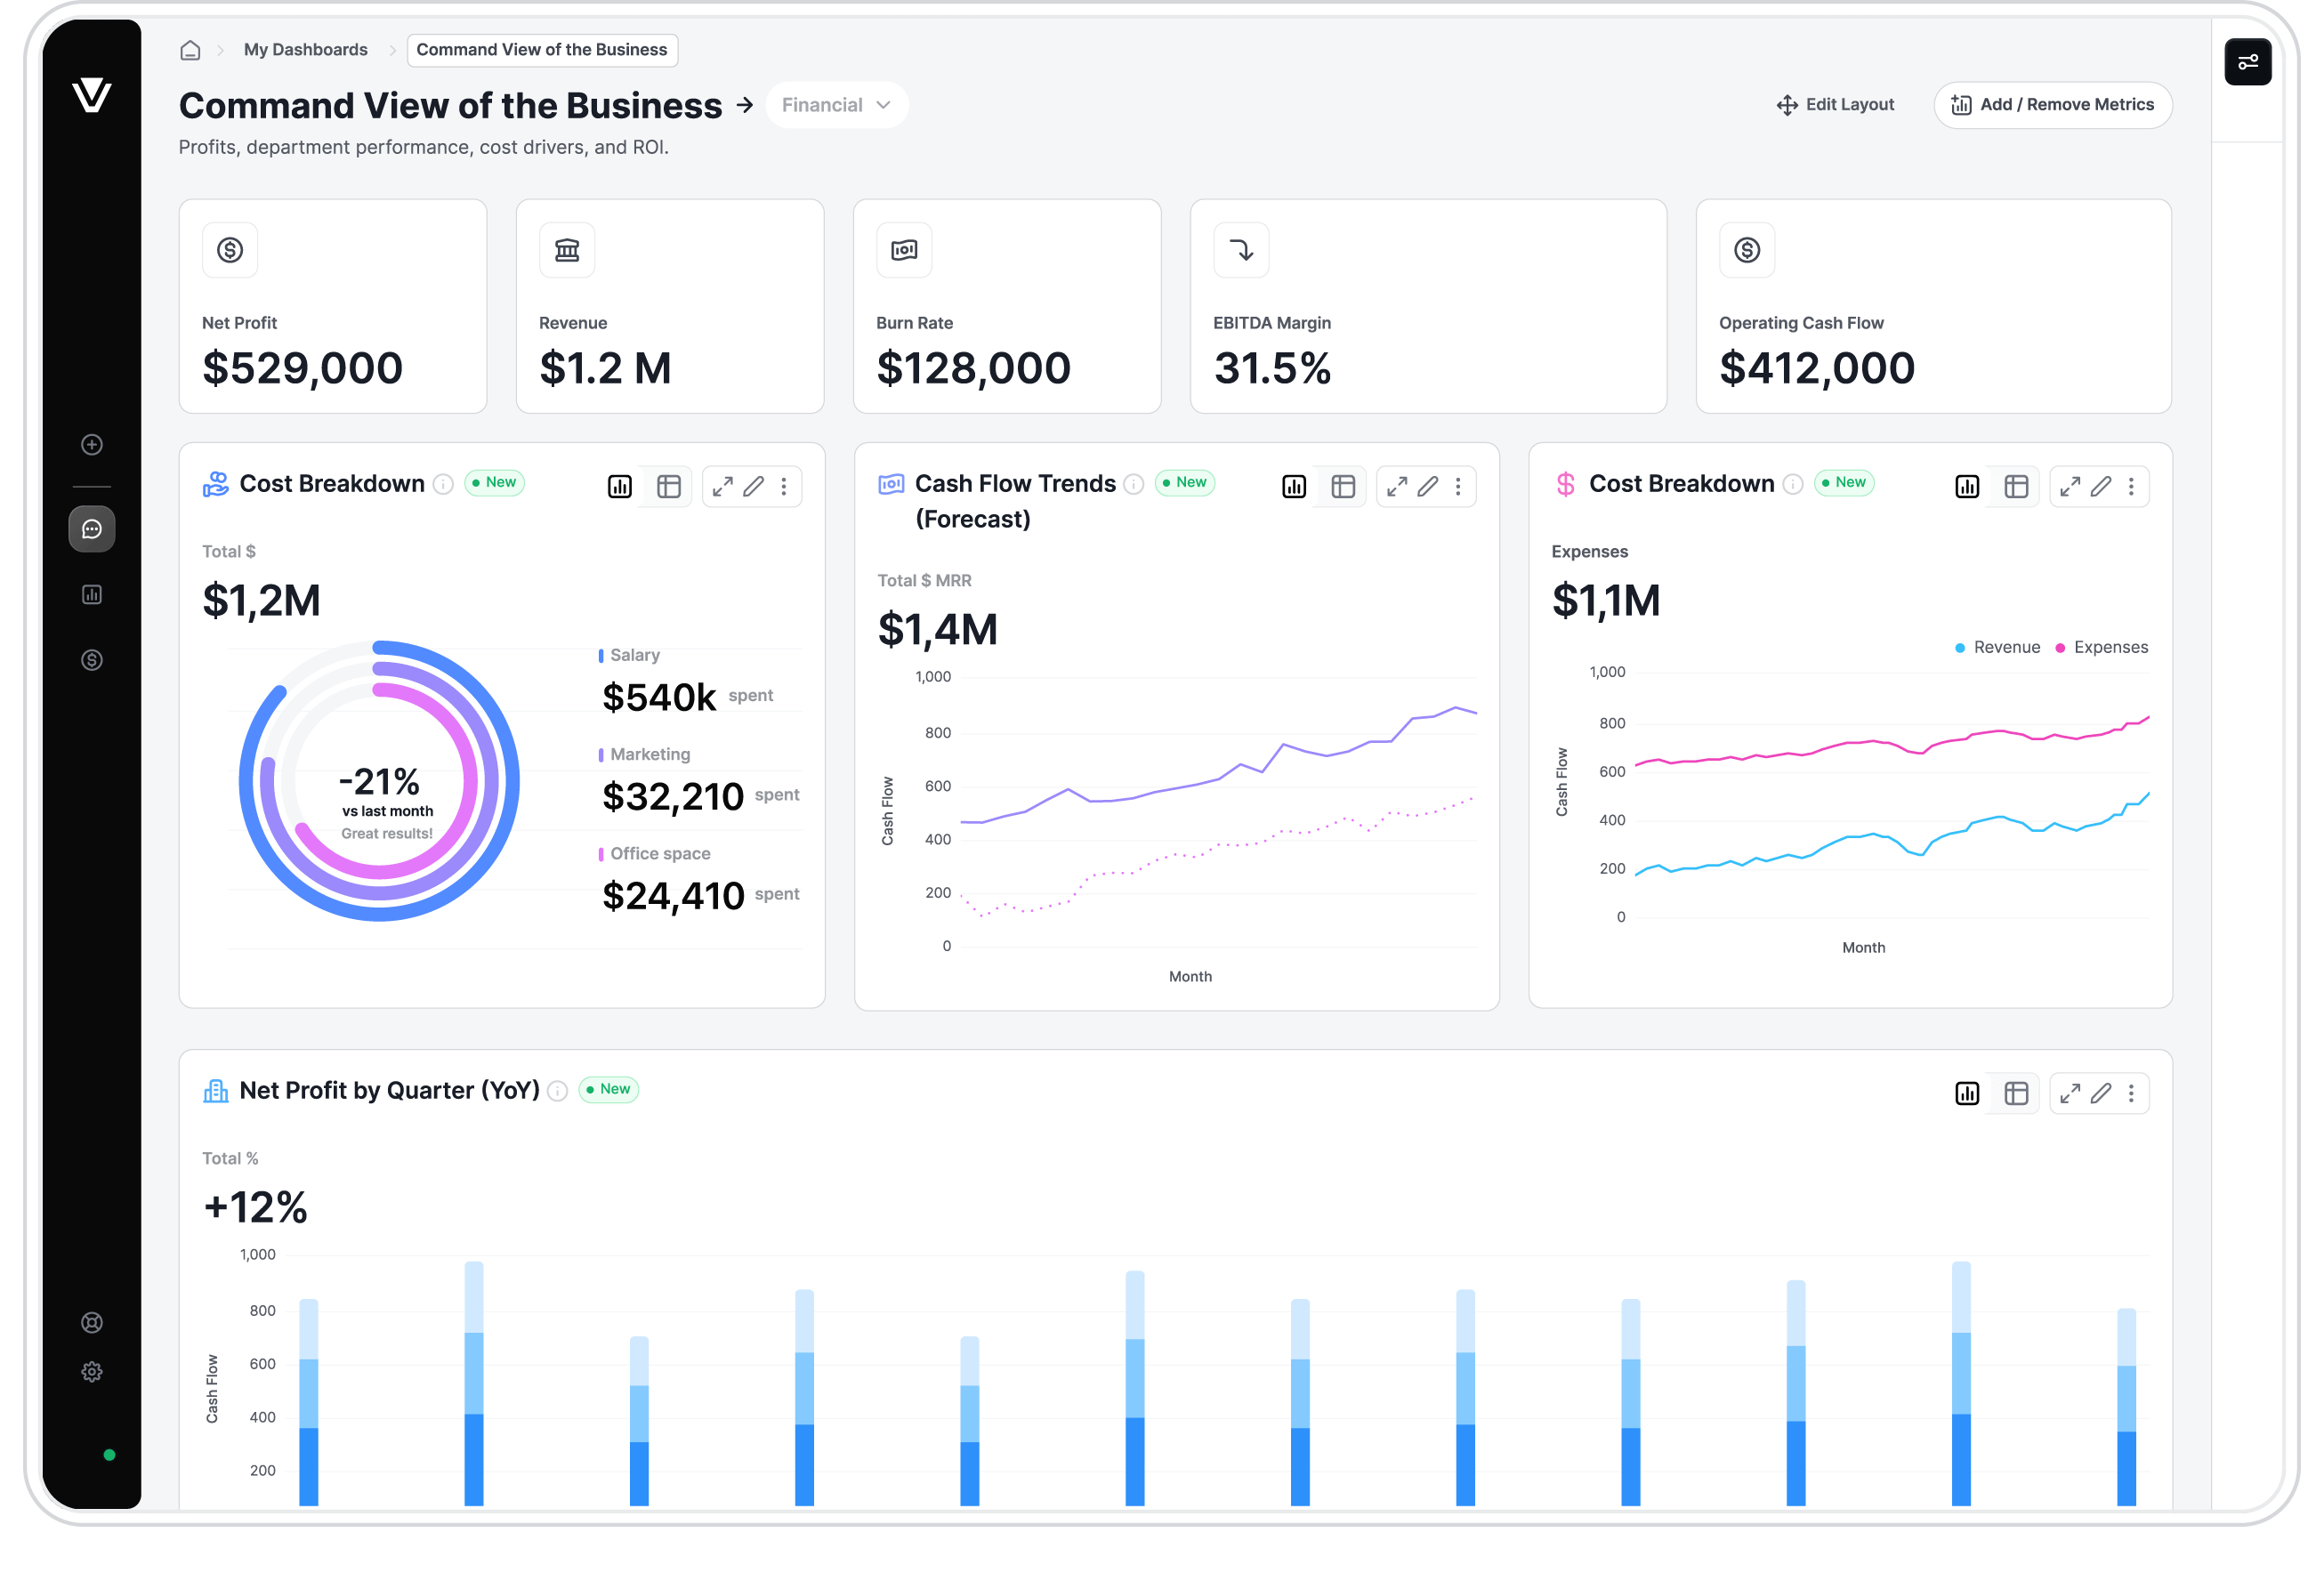
Introducing Veltrix AI®
Interactive • Customizable • Insightful
After
Features
Your data. Your questions. Instant answers.
Chat with files, sources, and metrics — and get smart visualizations without writing a single line of code.
Watch video
Build dashboard
Ask questions in plain language - like 'What were sales last quarter?', and watch Veltrix build the chart instantly.
Watch video
Change to bar chart
Find the perfect view. Switch between bar charts, line graphs, and pie charts with a single click.
Watch video
File uploading
Connect any data. Drag and drop PDFs, or connect your apps - Veltrix organizes it all automatically.
Watch video
Chatting with AI
Dig deeper into the numbers. Ask follow-up questions like 'Why did costs spike in May?' to get instant context.
Watch video
Metric customization
Refine your analysis. Toggle metrics on or off to focus your dashboard on exactly what matters.
Prev
Next
Conversational Analytics
Ask questions in plain language — like “What were sales last quarter?” — and get instant answers.
Learn more
Track Performance
Visualize what matters. Filter, export, and drill down into reports — no technical skills required.
Learn more
Instant Data Processing
No setup, no manual parsing. Just connect your data and watch it transform into answers.
Learn more
The Smarter Way to Turn Raw Data into Actionable Insights
Trusted by FP&A leaders, Controllers, and Founders to deliver answers fast.
Connect Any Data Source
Financial statements, Google Drive, Apps & more
Seamlessly integrate PDFs, spreadsheets, and accounting software — from reports to real-time sources.
Secure & Scalable
Enterprise-grade infrastructure
Role-based access, encryption, and audit logs to keep your financial data safe.
Instant Dashboards
Automated Visuals in Seconds
Auto-generate visual dashboards with charts, KPIs, and summaries. Zero setup.
Multi-File Analysis
Analyze multiple files at once
Upload bulk reports or sync live feeds — compare, combine, and drill down effortlessly.
AI-Powered Analysis
Automated Data Extraction
Our engine automatically identifies trends, anomalies, and key drivers.
Why Finance Teams Choose Veltrix?
Built for speed, scale, and clarity — go from raw data to smart decisions in minutes.
100
+
Custom dashboards launched
6
×
Faster decision-making
5
+
Countries already onboard
You Upload. Veltrix Analyzes.
Turn raw data into clear answers in seconds
Try with your Data
Start Using
Veltrix Today!
Instant access — no credit card needed
One-on-one onboarding support
Explore every feature from day one
Learn more
Get Started
BETA ACCESS — LIMITED SPOTS
Get Early Access to Veltrix AI
Turn your raw data into smart, interactive dashboards — effortlessly.
Join our beta waitlist and help shape the next generation of data intelligence.
Email *
🔒 Your email is safe with us. We’ll only use it to send beta updates.
By registering, I accept the
Privacy Policy
and
Terms of use
Priority access to beta testers
Direct input on product development
Exclusive product updates before launch
Not Now
You’re on the List!
Thanks for signing up — you’ll be among the first to know when Veltrix AI goes live.
Ok
Oops! Something went wrong while submitting the form.


.svg)


.png)