.webp)

Your entire pipeline, instantly understood.
Secure AI for growth teams and business owners. Unify your sales and accounting apps to uncover the "why" behind your revenue and eliminate blind spots.
14-day free trial • Cancel anytime • Veltrix never changes your tools.
Integrations
Unify Your Growth Stack
Veltrix connects your sales, marketing, and finance tools via official, read-only links. Get a real-time big picture of your entire pipeline without using your account credits.
Thank you! Your submission has been received!
Oops! Something went wrong while submitting the form.
Choose our next integration!

HubSpot
Already Live
.svg)
Saleforce
0
Upvote

.svg)
Google Ads
0
Upvote
.svg)
Pipedrive
0
Upvote
.svg)
Mailchimp
0
Upvote
Maximize ROI
Find Your True Ad Profit
Go beyond clicks. Veltrix cross-references your ad spend with your actual bank data. See which campaigns bring in profitable customers and uncover the "why" behind your ROI shifts instantly.
Pipeline Health
Track Your Growth Velocity
Stop relying on disconnected reports. Veltrix unifies your sales pipeline and financial history to show exactly how your deals affect your cash runway based on real historical data.
Revenue Protection
Understand Every Deal
Link HubSpot or Salesforce to see exactly where deals get stuck. Veltrix unifies your sales data with your cash flow so you never "not understand" your revenue.
Revenue Protection
Identify At-Risk Deals Instantly
Don't be blindsided by deals slipping. Ask Veltrix to identify deals without activity so you can focus your team's efforts where it matters most and save your quarter.
Strategy Analysis
Prove the Value of Your Strategy
See what actually drives growth. Link your pipeline data to find out which assets help close your biggest deals and get proactive advice on what to do next.
How It Works
Platform Capabilities
Everything you need to answer tough questions.
Powerful, self-serve revenue and growth analytics to help you close more deals.
#1

Securely Link Your Apps.
Sign in via official, read-only connections. As safe as a Google Login with zero impact on your account credits.
AI Unifies the Dots.
Our private AI cross-references your sales and spending to find the hidden links and the "why" behind your business numbers.
Never Not Understand.
Ask questions in plain English to get instant insights, charts and recommendations.
.webp)

.webp)
.webp)
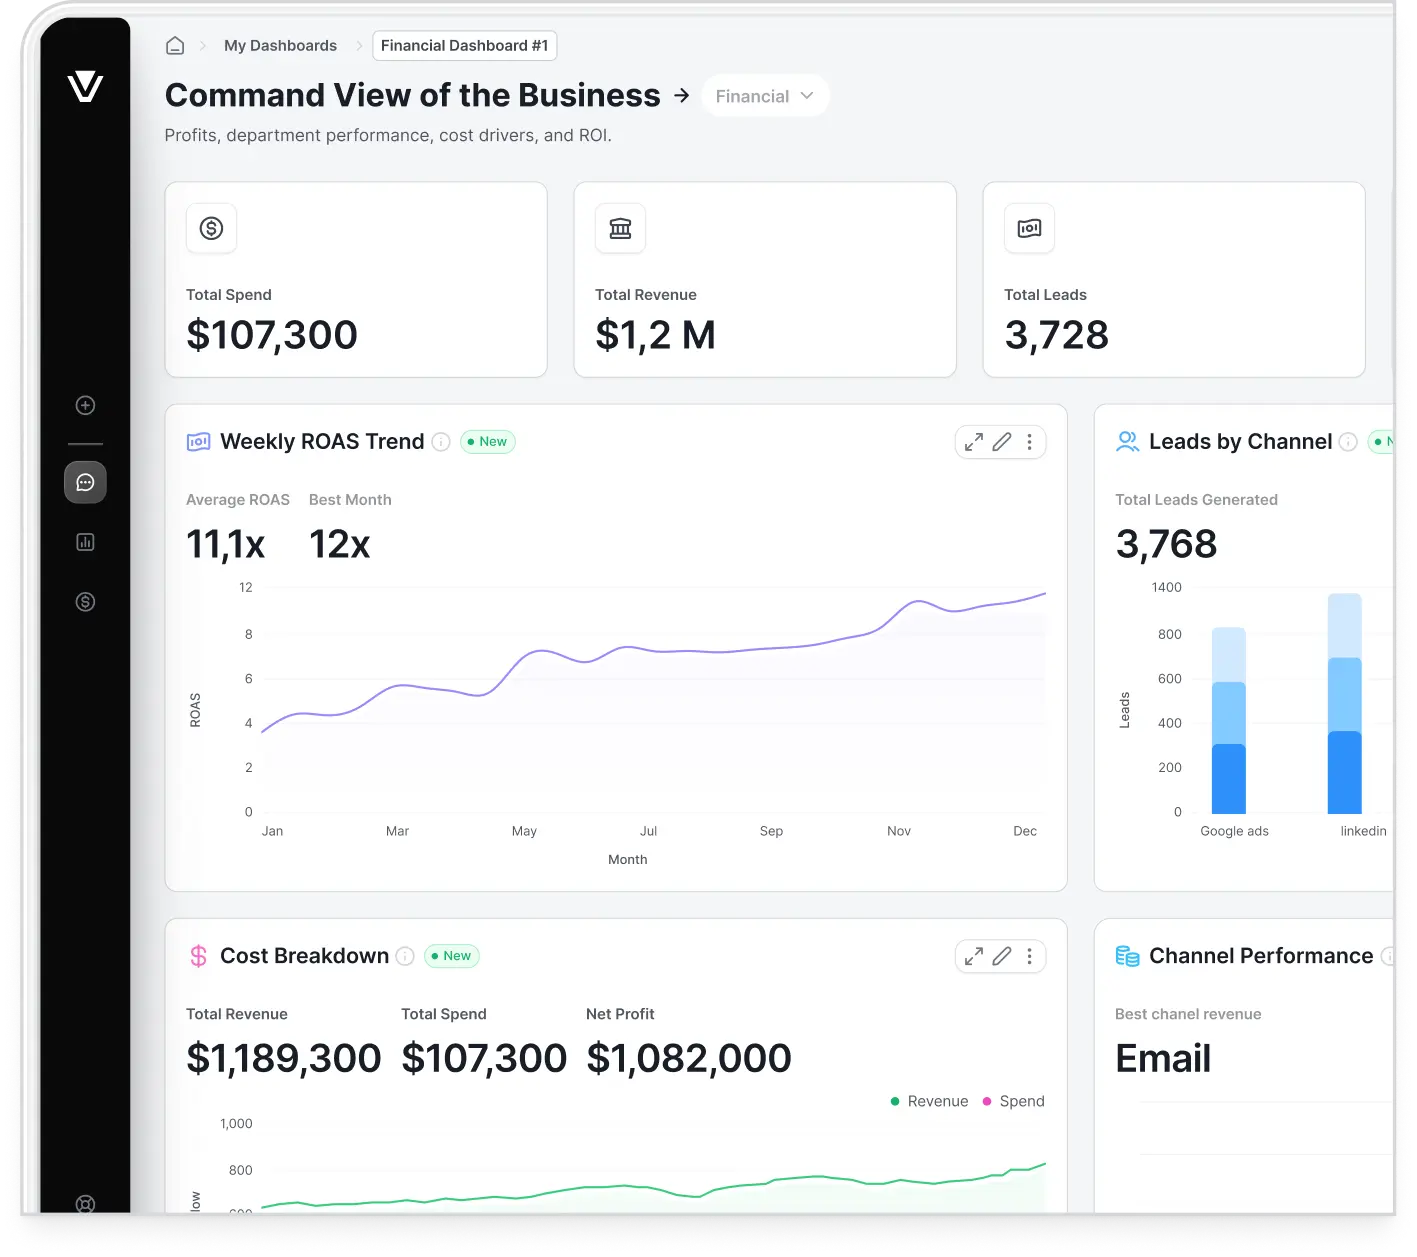
See Your Business Vitals Instantly
This isn't a video. Experience the "Aha!" moment yourself with a real, interactive and free version of Veltrix.

.png)
Ready to Understand Your Entire Business?
Stop wasting hours on manual spreadsheets. Join the teams trading disconnected apps for a unified, real-time big picture.

FAQs
Everything you need to know about the product and billing. Can’t find the answer you’re looking for? Please chat to our friendly team.
.svg)
How is this different from HubSpot or Salesforce's built-in reporting?
CRM reports only show sales. Veltrix unifies sales, marketing, and accounting into one real-time view so you get the big picture of your entire business pipeline.
.svg)
Is our growth and financial data secure?
Yes! We use official, native APIs created by the apps themselves. We have strict "Read-Only" access; we can never change your data.
.svg)
Do you use our data to train public AI?
Never. Veltrix features Amnesia by Design. Your data is only yours, is never used to train public AI models, and our system erases your business context if you disconnect.
.svg)
Is this for technical users or can my whole team use it?
Veltrix is built for everyone. If you can ask a question in plain English and upload a file, you have all the technical skills you need. It's designed to empower marketing and sales teams to get their own answers, fast.
.svg)
Can this help my individual account executives?
Absolutely. Team members can link their specific tools to visualize their territory and identify bottlenecks instantly—it’s like giving every rep a personal strategic assistant.
What happens when you launch direct integrations?
As a Veltrix user, you'll be the first to know. We are constantly adding tools like Mailchimp and Stripe to ensure you can eventually unify your entire stack in one click.